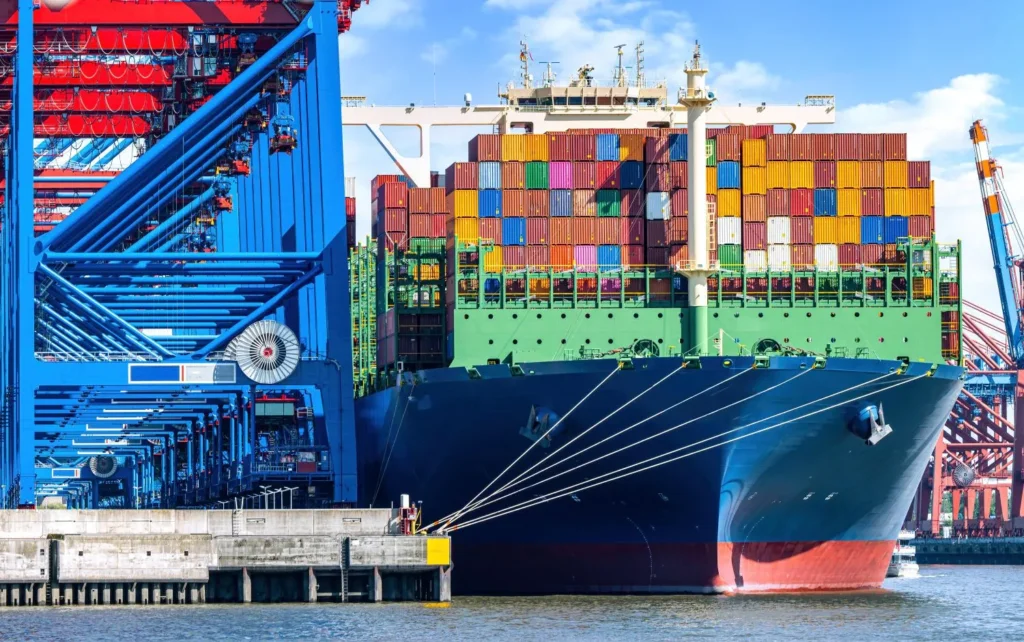
A new report by emissions reporting company VesselBot has examined the CO2 emissions from container vessels in Q1 2024.
The report claims that despite the Suez crisis, emissions per TEU shipped were actually down year-on-year.
Highlighting the impact of trade route changes
One unsurprising finding in the VesselBot report is the significant effect that altered trade routes have had on emissions.
The report highlights the substantial rerouting within the Red Sea due to security concerns. As is well known, this has led to the largest diversion in sea trading routes in decades.
These changes have not only affected the distance covered by vessels, but also the overall emissions generated, as vessels have naturally had to travel greater distances and adjust their speeds and loading patterns to accommodate new routes.
However, despite this, there was a 3.8% year-on-year reduction in average TEU intensity, which VesselBot says means CO2 emissions compared to Q1 2023 actually fell.
CO2 emission intensity and vessel utilisation
Expanding on this, VesselBot explains that a key metric analysed in the report is CO2 emission intensity, measured in WTW g CO2e/TEU-km.
This metric, argues VesselBot, provides a standardised approach to evaluating the environmental efficiency of sea transportation.
“In VesselBot’s report, the most critical metric analysed is the CO2 emission intensity (WTW g CO2e/TEU-km). This valuable metric, measured in TEU, offers a standardised approach to assess the environmental efficiency of sea transportation, particularly in the context of container shipping. Measuring emissions in terms of TEU provides valuable insights into the environmental impact per unit of cargo transported, enabling the identification of opportunities to reduce maritime emissions,” says the company.
VesselBot says that these vessel utilisation rates significantly influence emission intensity. For instance, it is said that a vessel operating at 60% capacity has a higher emission intensity than when operating at full capacity.
Short-range voyages and emission intensities
VesselBot’s analysis of voyages in the first quarter of 2024 also identifies short-range routes, particularly within Eastern Asia, the Americas, and the Mediterranean, as the biggest contributors to high CO2 emission intensities.
These voyages, often conducted by older, smaller feeder vessels, have the highest intensities due to their operational inefficiencies and frequent port manoeuvres.
Emissions by flag state and regional analysis
Another section of the report looks into the emissions of different flag states, revealing notable variations.
Although Liberia has the largest container vessel fleet and this substantial total emissions, its emission intensity per vessel is relatively low.

In contrast, the report claims that flag states like the Faroe Islands exhibit high emission intensities due to smaller fleets and less efficient operations.
Finally, the report adds that regionally, China and the United States are the largest contributors to cumulative CO2 emissions. Naturally, this is down to both countries’ extensive port networks and high volume of maritime traffic.

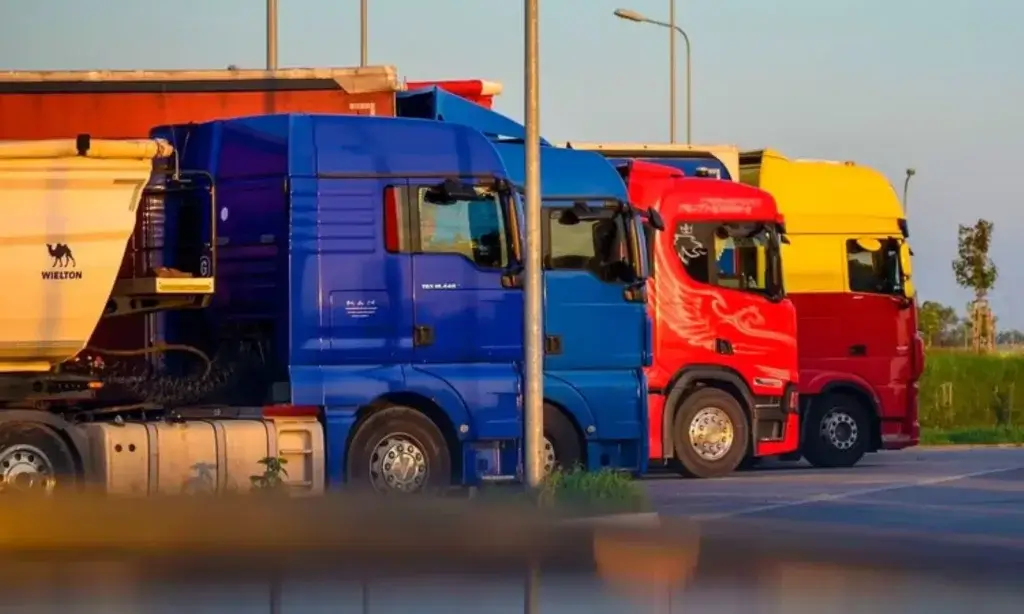
Photo by Andres Canavesi on Unsplash